Quantcast
Channel: Seth Guthrie's Activities
Viewing all 1421 articles
Browse latest View live

Microstran Dynamic Analysis

$
0
0

  
 Applies To 
  
 Product(s):Microstran
 Version(s):V8i
 Environment: N/A
 Area: Dynamic Analysis
 Original Author:Richard Collins
  

What Does Microstran Dynamic Analysis Do?

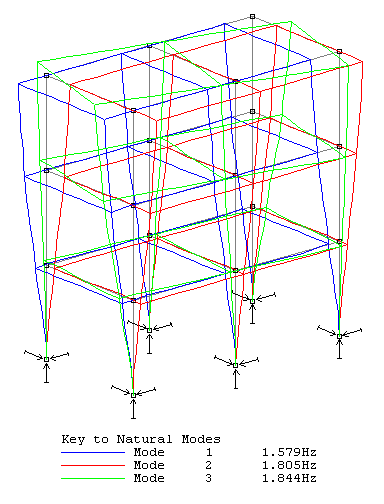
The first step in dynamic analysis is the determination of the frequencies and shapes of the natural vibration modes. In a 3-D structure there are three dynamic degrees of freedom (DDOF) for every unrestrained node with non-zero mass and there is potentially a natural vibration mode for each DDOF. Thus, there may be hundreds of potential vibration modes in a typical structure, but usually, it is only a small number of vibration modes with the lowest frequencies that are of interest. In a multi-storey building, for example, it might be only a few in each of two horizontal directions, plus one or two torsional modes that have to be considered.

The vibration mode shapes are normalized. This means that the largest value in each tabulated mode shape is +1.0. Determining the natural mode shapes and frequencies does not provide any quantitative information about the response of the structure to excitation, but in some cases it may be sufficient to know what the natural frequencies are so they can be avoided. For example, if dynamic analysis shows that the lowest natural frequency of a structure supporting a vibrating machine almost coincides with the frequency of excitation, there would be a problem. It may then be possible to stiffen the supporting structure, thereby increasing the natural frequency so that it lies outside the troublesome range.

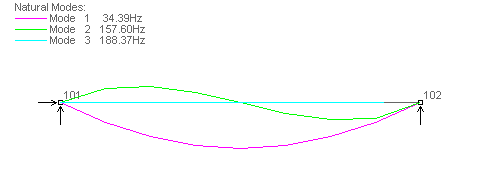
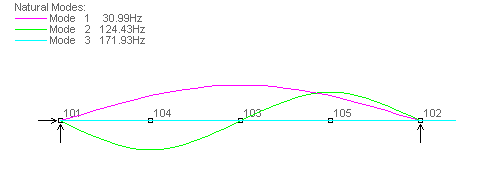
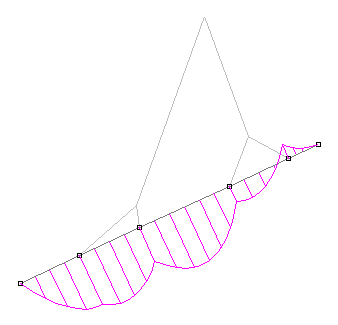
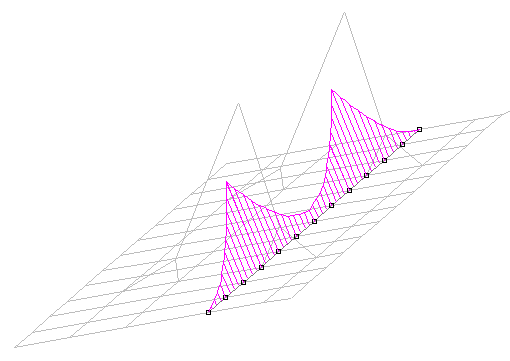
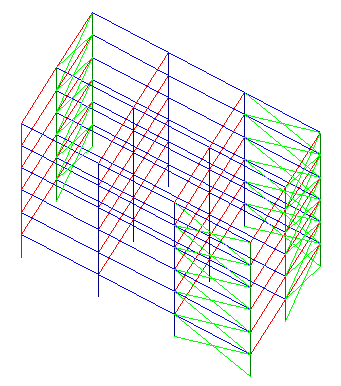
The first three natural vibration modes are shown for a simple unbraced building frame in the diagram below.

What's the Difference Between Lumped and Consistent Mass?

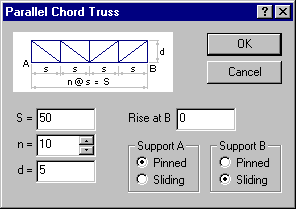
When dynamic analysis is initiated the following dialog box appears:

Dynamic Analysis Parameters

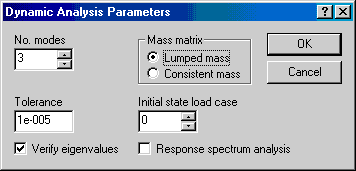
You may choose between lumped mass (the default) and consistent mass. With lumped mass, Microstran uses the simplifying assumption that all mass is concentrated at nodes, whereas with consistent mass, a more accurate formulation is used. The effect of this option is discussed below with respect to a simply supported beam.

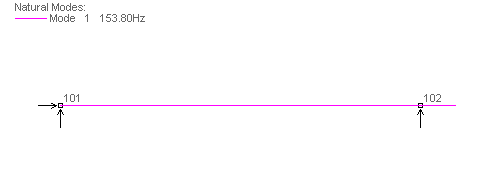
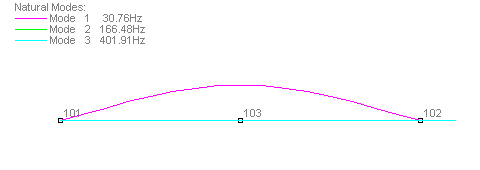
Case 1a - No Intermediate Nodes - Lumped Mass

In Case 1a, with lumped mass, half of the mass of the beam is assumed to be concentrated at each node.  Although the number of modes selected was three, only one was computed because, for lumped mass, this structure has only one dynamic degree of freedom (DDOF). This mode is the vibration of the beam in the direction of the longitudinal axis. The error in determination of this frequency is about -10% and no transverse modes are detected.

Lumped Mass


Case 1b - No Intermediate Nodes - Consistent Mass

In Case 1b, consistent mass was selected and now, the dynamic analysis finds two transverse modes with frequencies below that of the axial mode. The frequencies of these three modes are determined with errors of 11%, 27%, and 10%, respectively (the accuracy is best for mode shapes without points of inflexion).

Consistent Mass


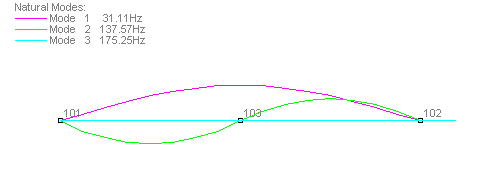
Case 2a - One Intermediate Node - Lumped Mass

In Case 2a (lumped mass), there is one intermediate node and it is assumed to have half the mass of the beam with the support nodes having one quarter each. The first transverse mode is found with an error of -1%, but the second transverse mode is not found at all. The second mode is the axial mode (error -3%) and the third mode found is actually the second axial mode.

Lumped Mass


Case 2b - One Intermediate Node - Consistent Mass

Case 2b, with one intermediate node and consistent mass determines the first three modes with errors of 0.4%, 11%, and 2.5%, respectively.

Consistent Mass


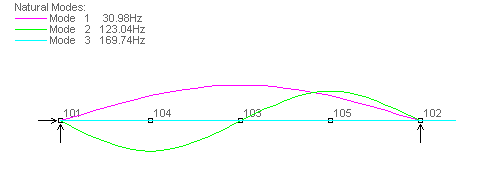
Case 3a - Three Intermediate Nodes - Lumped Mass

Case 3a, with three intermediate nodes, provides frequencies that for practical purposes are exact (errors of 0.03%, 1%, and 0.7%).

Lumped Mass


Case 3b - Three Intermediate Nodes - Consistent Mass

Case 3b, with consistent mass, provides a slight improvement in accuracy over Case 3a.

Consistent Mass


Summary

In deciding whether to use lumped mass or consistent mass you should consider the type of structure you are analysing, how it has been modelled, and the shape of the natural modes that are of primary interest.

Generally, use lumped mass:

  • For models with many nodes.
  • When modes of interest do not involve transverse displacement of members between nodes.

Generally, use consistent mass:

  • For models with few nodes.
  • When modes of interest do involve transverse displacement of members between nodes.

What is Response Spectrum Analysis?

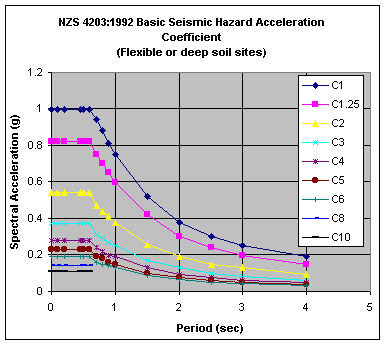
Response spectrum analysis (RSA) is a procedure for computing the statistical maximum response of a structure to a base excitation (or earthquake). Each of the vibration modes that are considered may be assumed to respond independently as a single-degree-of-freedom system. Design codes specify response spectra which determine the base acceleration applied to each mode according to its period (the number of seconds required for a cycle of vibration). The diagram below shows the Basic Seismic Hazard Acceleration Coefficient specified in NZS 4203 for deep soil sites (the most severe site category). Each curve represents a different ductility factor. The design response spectrum is obtained by multiplying these curves by a structural performance factor, a risk factor, a zone factor, and limit state factor. Other earthquake loading codes have similar provisions. Click here if you want to download a Microsoft Excel spreadsheet file containing Australian and New Zealand design code response spectra (Spectra.xls - 35K).

Having determined the response of each vibration mode to the excitation, it is necessary to obtain the response of the structure by combining the effects of each vibration mode. Because the maximum response of each mode will not necessarily occur at the same instant, the statistical maximum response, where damping is zero, is taken as the square root of the sum of the squares (SRSS) of the individual responses.

Response spectrum analysis produces a set of results for each earthquake load case which is really in the nature of an envelope. It is apparent from the calculation method, that all results will be absolute values - they are all positive. Each value represents the maximum absolute value of displacement, moment, shear, etc. that is likely to occur during the event which corresponds to the input response spectrum. Care must be taken when using these values for member design to consider the negative of each value as well. This is done most conveniently by including two design load cases for each earthquake load case, one with the RSA results factored by 1.0 and the other with them factored by -1.0.

See Also

RAM Frame - Dynamic Modal Analysis FAQ

RAM Elements Dynamic Modal Analysis FAQ


Microstran Elastic Critical Load Analysis

$
0
0

  
 Applies To 
  
 Product(s):Microstran
 Version(s):V8i
 Environment: N/A
 Area: Analysis; Design
 Original Author:Richard Collins
  

Why Does ECL Analysis Give Such High k Factors?

The effective length of a given member in a frame is the length of an equivalent pin-ended member whose Euler load equals the buckling load of the frame member. The effective length factors, kx and ky, are factors by which we multiply the actual length of the member in order to obtain the effective lengths for buckling about the section XX and YY axes, respectively. When designing the frame member by traditional methods, we take account of the stiffness of connected members to obtain the effective length and then we consider it as if it were an isolated member of an appropriate length. We could then determine the axial load required to cause column buckling in this equivalent member.

ECL analysis allows us to determine the frame buckling load factor for a given load case. Frame buckling occurs when the axial forces for the given load case are factored to the point where the frame collapses. Display the buckling mode shape of the frame and you can see how the frame buckles. Frame buckling for a given load case is usually a complex interaction of several members - there is not necessarily any one member which causes the buckling of the frame. In this situation, if we apply our definition of effective length, we find that the effective length of a given member for a given load case is the length of an equivalent pin-ended member whose Euler load equals the load in that member when frame buckling occurs. Thus, any member carrying a small axial load at frame buckling will have a large effective length. Also, the effective length of a member will vary from one load case to another. It is only where a member could be said to be critical (i.e. participating to a large degree in the buckling mode), that the effective length factor could be compared with the value used in traditional methods.

In general, traditional effective length factors relate to the buckling load of the member being considered whereas the effective length factor computed by ECL analysis relates to frame buckling.

What Effective Length Factor Should I Use for Design?

ECL analysis computes effective length values for each member, for each load case. These may be input automatically to steel design procedures, or you may input values yourself. Can you use ECL analysis to determine the "effective length" of a member for design? Yes, but you must interpret the values carefully.

To determine the traditionally accepted effective length of a given member of a frame, you could use either of two approaches:

  • Examine the buckling mode shapes for appropriate load cases and choose a k factor by relating the behaviour of the member in question to the simple buckled shapes used in the design code for classification of effective lengths.
  • Construct a load case whose frame buckling mode involves the primary buckling of the member in question and use the computed value.

See Also

RAM Elements Unbraced Lengths

RAM Elements Effective Length Factors

Microstran Restraints and Releases

$
0
0

  
 Applies To 
  
 Product(s):Microstran
 Version(s):V8i
 Environment: N/A
 Area: Modeling; Analysis
 Original Author:Richard Collins
  

What's the Difference Between Restraints and Releases?

A restraint may be applied to a node to create a fixed support while a release may be inserted at either end of a member to create an internal hinge. The default condition for a node is unrestrained and the default condition for a member is without releases. Thus, as you draw new members with graphical input, the nodes initially are not supports and the members initially have no releases (unless you change the default condition for new members). This is just what you would expect because, usually, most nodes are unrestrained and most members don't have releases.

At each node there are six potential degrees of freedom (DOF), each corresponding to a global axis translational or rotational direction. Each DOF may be either free (the DOF exists) or fixed (a "restrained DOF", i.e. the DOF does not exist). Strictly speaking, the term "release" is not used in connection with nodes.

At each end of a member, there are six potential releases (but they can't all exist together). When they do not exist, the member end is rigidly connected to the adjacent node. This condition is sometimes described as "fixed" but we prefer not to use "fixed" in connection with members because it is imprecise - if the member end is fixed, is it fixed absolutely (as in "fixed-end moment") or is it merely "fixed" to the node? We may refer to "releases" being present or not, or we may describe the member end as being continuous with the adjacent node or not. When a release exists, the corresponding member force component is "released" (i.e. it becomes zero).

Why Are There Different Conventions for Restraints and Releases?

The short answer is that they are the same.

This question refers to the fact that Microstran uses a "1" in the restraint code to denote fixity at a support and a "0" in the release code to denote the absence of a release. There is a superficial similarity between these two conditions and the confusion arises because Microstran describes one with a "1" and the other with a "0". The superficial similarity, however, is caused by the imprecise use of the term "fixity" in connection with member end releases (see What's the Difference Between Restraints and Releases?, above). Microstran's use of "1" and "0" for restraint codes and release codes is explained in terms of simple English - "1" means "yes" and "0" means "no" - if a restraint or release exists, use a "1"; if it does not exist, use "0". Note also that the default condition for nodes and members is zero, i.e. no node restraints, and no member releases.

Similarly, Microstran uses a "0" to denote the absence of fixity at a node while "1" denotes the presence of a release at the end of a member. In this case, the similarity between the two conditions is more than superficial because you could create the same pinned support with either (but not both together). Perhaps you should not be asking why a similar outcome can be produced by a "1" in one place or a "0" in another, when "restraint" and "release" are almost opposites in plain English!

Why Are "1" and "0" Used Instead of "F" and "R" for Restraints and Releases?

To avoid ambiguity - for instance, does "F" mean "Free" or "Fixed", and does "R" mean "Restrained" or "Released". Microstran uses the simple convention that "1" means "yes" and "0" means "no". For example, if a restraint or a release exists, we use "1"; if it does not exist, we use "0". This means that the default, or usual, situation for node restraints and member releases is indicated by zeros.

Microstran Plastic Analysis of Frames

$
0
0

  
 Applies To 
  
 Product(s):Microstran
 Version(s):V8i
 Environment: N/A
 Area: Analysis
 Original Author:Richard Collins
  

Plastic Analysis of Frames

You may use Microstran's optional fuse members to perform both first-order and second-order plastic analysis of simple frames. This is illustrated with an example from page 330 of The Behaviour and Design of Steel Structures to AS 4100, 3rd Edition by Trahair & Bradford. The frame and loads are shown below in a diagram from the book.

FRAME AND LOADS

The collapse mechanism determined in the book is shown below. The calculated collapse load factor is 1.583.

PLASTIC COLLAPSE

The model was analysed using non-linear analysis with second-order effects turned off, effectively a first-order analysis. With a load factor of 1.565 the bending moments and axial forces determined were within 1.5% of the published values. With a greater load factor analysis failed, indicating collapse. The model is shown below. At each location where a plastic hinge could develop, a short length of the parent section is replaced by a pair of plastic fuse members.

MICROSTRAN MODEL

Each plastic fuse member represents the area of the parent section above or below the centroidal axis (i.e. half the area of the parent section) and is located at the centroid of this area. All other geometric section properties of the fuse member are zero. Maximum tension and compression forces are computed from the yield stress and specified for each fuse.

Each fuse member is connected at one end to the parent section by rigid offsets and the other end is connected to a node that is slaved to a master node at the intersection point. The node connecting the rigid offsets is slaved for translational DOF to the master node. For UB and UC sections, you can easily determine the centroidal offset for the fuse members by showing the properties of the corresponding tee section in the Library Manager.

PLASTIC FUSE MEMBERS

Microstran Analysis of Tilt-Up Panels

$
0
0

  
 Applies To 
  
 Product(s):Microstran
 Version(s):V8i
 Environment: N/A
 Area: Analysis; Modeling
 Original Author:Richard Collins
  

Analysis of Tilt-Up Panels with Microstran

An Excel spreadsheet is available to assist in the use of Microstran for the analysis of tilt-up panels. The spreadsheet relates to the structure shown below:

Tilt-Up Panel - Model

The red members are slings, modelled with catenary cable elements, and the blue members represent the reinforced concrete panel. There is a pin support at node 1 and a vertical support at node 99. There are sheaves at nodes 99, 100, and 101, so that the tension in each sling is the same on each side of the supporting sheave.

The spreadsheet is shown below. Values shown in red are entered and the coordinates of all nodes are calculated automatically. The X and Y coordinates of the nodes are selected in Excel and copied to the Windows clipboard by clicking the Copy button. These coordinates are then pasted into the Microstran node coordinate view and the correct geometry for the tilt-up panel and slings is instantly displayed.

Tilt-Up Panel - Spreadsheet

Non-linear analysis is performed in Microstran and the results can be displayed in various ways. The bending moment diagram for the tilt-up panel at an elevation of 25 degrees is shown below:

Tilt-Up Panel - Bending Moment

As shown below, the model may be extruded in the Z global axis direction to create a 3-D model for consideration of bending moment in the transverse direction.

Tilt-Up Panel - 3D Model

The spreadsheet is available at Free Stuff.

Microstran Design of Fall Arrest Systems

$
0
0

  
 Applies To 
  
 Product(s):Microstran
 Version(s):V8i
 Environment: N/A
 Area: Design
 Original Author:Richard Collins
  

General

Microstran may be used to assist in the design and evaluation of fall arrest systems consisting of a static line to which a person is attached by a lanyard incorporating a shock-absorber (personal energy absorber). The static line may be part of a network of cables analysed with Microstran’s catenary cable element option.

Standards such as AS/NZS 1891 and OSHA 1915.159 (U.S. Department of Labor) prescribe maximum arresting forces that may be applied during a fall. The main requirements of these two standards (for persons wearing a full body harness) are summarized in the table below.

 AS/NZS 1891OSHA 1915.159
Length of lanyard2 m6 ft (1.8 m)
Max. free fall distance2 m6 ft (1.8 m)
Falling mass100 kg310 lb (140 kg)
Max. arresting force6 kN1800 lb (8 kN)
Max. deceleration distance 3.5 ft (1.07 m)
Min. "pull-out" force2 kN 
Typical "pull-out" force 850 lb (3.75 kN)
Min. static tensile strength15 kN5000 lb (22.2 kN)

The shock-absorbing device that must be attached to the lanyard typically contains multiple layers of the lanyard webbing material fastened together with stitching designed to fail progressively ("rip-stitching"). The pull-out force is the force required to initiate irreversible extension of the device. Shock-absorbing devices that comply with the above standards ensure that the maximum deceleration force is not exceeded when the lanyard is attached to a rigid anchorage. Maximum deceleration forces will be reduced by any deflection in the supporting structure, and when this is a cable the deflection may be appreciable.

Cable networks may be analysed in Microstran if the catenary cable option is available. The load applied to the cable during a fall event may be assumed to be the maximum arresting force if the shock-absorbing device complies with the applicable standard. An accurate determination of the maximum dynamic force applied to the cable during a fall event requires consideration of the equilibrium of the falling mass together with the load-deflection characteristics of the combined structure/lanyard. This may be done in an Excel spreadsheet, in which the period of time from the end of the free-fall to the instant of maximum extension of the lanyard is considered in a large number of very small time increments.

Structure Stiffness

The stiffness of the cable network at the point of attachment of the lanyard may be represented in a load-deflection curve as shown in the diagram below.

Structure Stiffness

A load case is required for each point on the curve. As the structure is highly non-linear, several points will be required.

Lanyard Stiffness

The characteristics of the shock-absorbing lanyard may be represented in a load-deflection curve as shown in the diagram below.

Lanyard Stiffness

The first discontinuity in this curve represents first yield or "pull-out", the second is the point of full extension, and the last point represents the ultimate load. The lanyard should never be loaded past the point of the second discontinuity because the falling mass should have been decelerated to a stop before this point is reached.

Combined Stiffness

The load-deflection characteristics of the structure and the lanyard are combined in the spreadsheet into a single relationship by adding together the flexibilities of each. The resulting load-deflection diagram is shown below.

Combined Stiffness

The Spreadsheet

The spreadsheet tabulates 200 time intervals, each of 2 milliseconds. For each instant, using values from the previous instant and the load-deflection properties, formulas in the spreadsheet compute the velocity, the fall distance, the deflection of the combined structure/lanyard, the decelerating force, and the acceleration of the falling mass. Results are plotted in a graph, shown below. The spreadsheet summarizes maximum deflection, maximum force in the lanyard, and the maximum deceleration of the mass.


The spreadsheet is available at Free Stuff.

Microstran Response Spectrum Analysis to AS 1170.4

$
0
0

  
 Applies To 
  
 Product(s):Microstran
 Version(s):V8i
 Environment: N/A
 Area: Analysis
 Original Author:Richard Collins
  

An Excel spreadsheet, shown below, is available to assist in the use of Microstran Response Spectrum Analysis of structures to AS 1170.4. The procedure is described briefly in notes at the top of the spreadsheet. The spreadsheet calculates scale factors that have to be entered in Microstran dialog boxes during the response spectrum analysis. Values shown in the spreadsheet relate to this structure:

Earthquake Example

The spreadsheet is available at Free Stuff.

MICROSTRAN RESPONSE SPECTRUM ANALYSIS - AS1170.4    
     
PROCEDURE:    
1. Do dynamic analysis without RSA box checked.    
2. File > List/Edit File command, then choose Dynamic Log.    
3. Find fundamental period for direction of interest.    
4. Enter the values shown in red. Do not change anything else.    
5. Do static analysis with empty load case for RSA results.    
6. Repeat dynamic analysis with…    
a. RSA box checked.    
b. Green value entered in Response Spectrum dialog.    
7. Check dynamic log for 90% mass participation.    
8. Analyse > Response Spectrum then:    
In Dynamic Load Case Scale Factors dialog…    
- transfer Reaction value to blue value below    
- transfer magenta value below to Scale Factor.    
9. Create Input/Analysis report and check base shear    
for earthquake case.    
     
Acceleration coefficient, a =0.10 (Hobart=0.05 to Newcastle=0.11) 
     
Height, hn =12.0m  
Eq. 6.2.4(1):    
Fundamental period =0.26sec.  
Frequency (1) =3.83Hz.  
C(1) =0.306   
Eq. 6.2.4(2):    
Period for the orthogonal direction =0.21sec.  
Frequency (2) =4.83Hz.  
C(2) =0.357   
Minimum earthquake design coeff., C =0.286   
     
Structure period, T =0.81 (Fundamental period from dynamic analysis) 
     
Importance factor, I =1 (1.00 or 1.25) 
Eq. 6.2.3 =0.144   
Earthquake design coefficient, C =0.286   
Site factor, S =0.67 (Rock=0.67 to Soft clay=2.0) 
Structural response factor, Rf =3.0 (Masonry=1.5 to MRF=8.0) 
Gravity load, Gg =5766kN(9.81 x sum mass matrix diagonal - see dynamic log.) 
     
Earthquake base shear force, V:    
V, Eq. 6.2.2 =368kN  
V, lower limit =58kN  
V, upper limit =481kN  
V =368kN  
     
Microstran Response Spectrum dialog:    
Scale factor =0.327   
Microstran Dynamic Load Case Scale Factors dialog:    
Reaction =165kN(Value to be scaled according to Cl. 7.4.2.4) 
Percentage of Section 6 horiz. base shear force =90% (Irregular=100%, Regular=90%) 
Required base shear =331kN  
Scale Factor =2.004 (RSA values will be factored by this value) 

Microstran Response Spectrum Analysis to NZS 4203

$
0
0

  
 Applies To 
  
 Product(s):Microstran
 Version(s):V8i
 Environment: N/A
 Area: Analysis
 Original Author:Richard Collins
  

An Excel spreadsheet, shown below, is available to assist in the use of Microstran Response Spectrum Analysis of structures to NZS 4203. The procedure is described briefly in notes at the top of the spreadsheet. The spreadsheet calculates scale factors that have to be entered in Microstran dialog boxes during the response spectrum analysis.

February, 2000: The spreadsheet now interpolates for values of period and ductility factor that are not equal to values tabulated in the code.

Values shown in the spreadsheet relate to this structure:

Earthquake Example

The spreadsheet is available at Free Stuff.

MICROSTRAN RESPONSE SPECTRUM ANALYSIS - NZS4203 PART 4    
     
PROCEDURE:    
1. Do dynamic analysis without RSA box checked.    
2. File > List/Edit File command, then choose Dynamic Log.    
3. Find fundamental period for direction of interest.    
4. Enter values shown in red or orange. Do not change anything else.    
5. Do static analysis with empty load case for RSA results.    
6. Repeat dynamic analysis with…    
a. RSA box checked.    
b. Green value entered in Response Spectrum dialog.    
c. Response spectrum curve A1, B1, or C1 selected.    
7. Check dynamic log for 90% mass participation.    
8. Analyse > Response Spectrum then:    
In Dynamic Load Case Scale Factors dialog…    
- transfer Reaction value to blue value below.    
9. Repeat static analysis.    
10. Repeat dynamic analysis with…    
a. RSA box checked.    
b. Magenta value entered in Response Spectrum dialog.    
c. Response spectrum curve A1, B1, or C1 selected.    
11. Analyse > Response Spectrum    
12. Create Input/Analysis report and check base shear    
for earthquake case.    
     
Frequency of first mode, Hz =2   
Fundamental trans. period of vibration, T1 =0.50sec.  
Site subsoil category =a  (Rock=a - Deep soil=c)
Total seismic weight of structure, Wt =5515kN  
     
Structural ductility factor, u    
(Ratio: Max. displacement/Yield displacement) =3.00  (1.00 to 10.00)
Structural performance factor, Sp =0.67  (Always 0.67 ?)
Risk factor for structure =1.0  (0.6 to 1.3)
Zone factor, Z =0.6  (0.6 to 1.2)
Limit state factor, Ls =0.1667   
Limit state factor, Lu =1.0   
     
Equivalent Static Method:abc 
Serviceability limit state -    
Serviceability - Ch(T1,1) =0.630.771.00 
Ch(T1,1)*Sp*R*Z*Ls =0.04220.05160.0670 
Lateral force coefficient, C =0.0422   
Horizontal seismic shear force, V =233kN  
Ultimate limit state -    
Ultimate - Ch(T1,u) =0.260.320.37 
Ch(T1,u)*Sp*R*Z*Lu =0.10450.12860.1487 
For site subsoil category, this =0.1045   
Lateral force coefficient, C =0.1045  (Not less than 0.03)
Horizontal seismic shear force, V =576kN  
     
Modal Response Spectrum Method:    
Serviceability limit state -    
Sp*R*Z*Ls =0.0670   
Microstran RSA scale factor =0.66   
Ultimate limit state -    
Sp*R*Z*Lu =0.4020   
Microstran RSA scale factor =3.94  (Use this in first run with u=1 spectrum to obtain Vbase(1))
Combined modal base shear, Vbase(1) =1136  (Insert value from Microstran)
Design spectrum scaling factor, Sm1 =0.41   
Modal analysis scaling factor, Km =1.0  (0.8 or 1.0)
4.6.2.7(b) C =0.1045   
Design spectrum scaling factor, Sm2 =0.51   
Sm =0.51  (Max. of Sm1, Sm2)
Sm*Sp*R*Z*Lu =0.2040   
Microstran RSA scale factor =2.00  (Use this in final run with u=1 spectrum)


Feature-Related FAQs

Can't Change User Name for Reports

$
0
0

  
 Applies To 
  
 Product(s):Microstran; Limcon; MStower
 Version(s):V8i
 Environment: N/A
 Area: Reports; Configuration
Defect Number:112515
 Original Author:Bentley Technical Support Group
  

Problem Description

In the V8i releases listed below, the User Name, which is shown in the header of program output, is based solely on the Windows login name.

  • Microstran 09.20.01.18
  • Limcon 03.63.01.11
  • MsTower 06.20.01.08

In some situations, the user name may also include the suffix, "Not for Production Use"

Solution

An update release for all three applications is in progress and will have an option under File -> Configure -> General to override this and manually specify the desired User Name to show on the output.


build numbers with the solution; 

  • Microstran 09.20.01.21
  • Limcon 03.63.01.14
  • MsTower 06.20.01.09

Microstran Angle Between AB and AC Too Small

$
0
0

  
 Applies To 
  
 Product(s):Microstran
 Version(s):V8i
 Environment: N/A
 Area: Error messages
 Original Author:Bentley Technical Support Group
  

Angle Between AB and AC Too Small

"Member nn ref. node/axis - angle between AB and AC too small"

This error message may be displayed in the output window during the checking phase prior to an analysis. It occurs if the specified reference axis for a column is the vertical axis and in any other situation where the vector to the reference node is almost parallel to the longitudinal member axis (x).

GLOBAL AND MEMBER AXES

To understand what the error message means, look at the above diagram. The member x axis is AB and the y axis is computed using the vector cross-product of AB and AC. When the angle between AB and AC is zero the computation is impossible. If the angle is very small the computation is uncertain.

Fix the problem by double-clicking on the affected member and changing the reference node/axis. In many cases, the default reference axis is suitable.

Microstran Error Messages

$
0
0

Topics under this page include descriptions of Error Messages and Warnings as well as any known defects in Microstran.

Microstran Support Solutions

$
0
0

The TechNotes and FAQs in this section cover various topics that pertain to Microstran. Some also pertain to LIMCON and MStower. Use the navigation tree at the left to browse, or search for topics.

Many of the Support Solutions have been transferred from the legacy Microstran website, so the original FAQ index is maintained below:

Error Messages

Angle Between AB and AC Too Small

Windows Topics

Where Are My Toolbars?

Toolbars and Extra Buttons

How To Initialize Microstran Configuration Settings

Dual Monitor Operation

Windows Terminology

Exchanging Data Between Microstran and a Spreadsheet

Graphical Input

Extrusion

What's the Use of the Grid When Most Nodes Are Not on a Grid Point?

How Can I Input Nodes that Are Not on a Grid Point?

Load Sub-division

Restraints and Releases

What's the Difference Between Restraints and Releases?

Why Are There Different Conventions for Restraints and Releases?

Why Are "1" and "0" Used Instead of "F" and "R" for Restraints and Releases?

Modelling

What's the Difference Between a Constraint and a Restraint?

Master-Slave Constraints

Instability and Ill-Conditioning

Common Modelling Problems

Plastic Analysis of Frames

Analysis of Tilt-Up Panels

Design of Fall Arrest Systems

Non-Linear Analysis

Why Do I Have to Select Which Load Cases Are Analysed?

Saving Time with Non-Linear Analysis

Steel Design

Adding a Section to the Steel Library

Restraints for Steel Design

How Can Normal Grade Be Stronger Than High Grade

Angles

Dynamic Analysis

What Does Microstran Dynamic Analysis Do?

What's the Difference Between Lumped  and Consistent Mass?

What is Response Spectrum Analysis?

Earthquake Analysis to AS 1170.4

Earthquake Analysis to NZS 4203

Elastic Critical Load Analysis

Why Does ECL Analysis Give Such High k Factors?

What Effective Length Factor Should I Use for Design?

RAM Concept - Design Details

$
0
0

I am using RAM concept to design an elevated slab supported by both interior columns and edge walls. This is an existing structure, so I have modeled all of the existing steel with hopes of checking it against the current and proposed future loading scenarios. After running my design, I'm getting some (not all) of the design strips to show "Failed: 7.12." When I go to that section of the code, it is referring to the minimum temperature and shrinkage steel section.

My slab is 14" thick with #5@12 each way, top and bottom. This would give me about 0.31 sq. in. per foot for both top and bottom in each direction. Based on the code checks, I would require ~0.0018(14")(12") = 0.3024 sq. in. of steel per foot. Is there a way I can look at a more detailed version and see WHY they noting this location as a failure? Any thoughts as to why this might be flagged?

I have another location where I have some failures but wanted to be able to gut check this first failure before moving on to the more specific locations. 

Convert vertical load to horizontal load

$
0
0

Hi All

Here in Denmark Seismic loading is merely defined as a percentage of the applied vertical load. In the past i've used NOTIONAL LOADS to create this and it worked fine. But only for Y axis as global vertical axis. I now use SET Z UP since it corresponds to the axis definitions all our clients use.

However, notional loads doesn't seem to Work properly when the command SET Z UP command is used. Can anyone explain this?

The alternative is to manually copy all vertical loads and change direction in the STAAD.Editor. But this is a very time consuming task and it also rather frustrating since loads tend to change a lot during the design phase.

Can anyone help me to explain this or alternatively give me a tip to avoid the manual re-entry of loads? Perhaps someone has created a macro for a similar task?

Thank You.

Kind regards

Morten


Microstran Excel Spreadsheet Extensions

$
0
0

Here are some Excel spreadsheets that might be useful.

Click the download icon above to download or open a compressed exe of the files. Run the executable to unpack the spreadsheet files to any location on the hard drive. A brief decription of the enclosed spreadsheets is below.

File NameSize (Kb)DateDescription
Beam.XLS15816/03/00BMD, SFD, deflection for single span beam.
Beam2.XLS23421/03/00BMD, SFD, deflection for two span continuous beam.
Section.XLS3716/03/00Calculate properties of section.
Arrest.XLS8316/03/00Fall arrest system - calculate maximum deceleration force.
Spectra.XLS5816/03/00Earthquake design response spectra for AS 1170.4 and NZS 4203.
As1170_4.XLS3022/03/00Earthquake design to AS 1170.4.
Nzs4203.XLS4716/03/00Earthquake design to NZS 4203.
Hambly.XLS1916/03/00Calculate properties of Hambly cruciform element.
Tilt_up.XLS3416/03/00Calculate sling geometry for tilt-up panel.
Arch.XLS2416/03/00Calculate coordinates on parabolic curve - see Copy & Paste.
Pressure.XLS6316/03/00Barometric pressure as a function of altitude.

Disclaimer

Bentley Systems makes no warranty of any kind in connection with this material.  Users of the material are advised that output from computer software should be subjected to independent checks.

Microstran Exchanging Data with Spreadsheets

$
0
0

  
 Applies To 
  
 Product(s):Microstran
 Version(s):V8i
 Environment: N/A
 Area: User Interface, Modeling
 Original Author:Richard Collins
  

Exchanging Data Between Microstran and a Spreadsheet

Exchanging data between Microstran and a spreadsheet program can be very useful in some situations. For example, you might want to calculate node coordinates in a spreadsheet and then transfer them to Microstran without having to type them in. This is a simple procedure and an example is presented below to illustrate the necessary techniques.

The steps we are going to follow are:

  1. Create a parallel-chord truss using Standard Structures Input.
  2. Sort the nodes so the nodes in each chord are consecutively numbered.
  3. Copy the range of X coordinates from the node table in Microstran's Table Input to the Windows clipboard.
  4. Paste the range of X coordinates from the clipboard to the spreadsheet.
  5. Enter the desired parameters into the spreadsheet, which then calculates the Y coordinates of the chords for a trussed arch. Click here if you want to download the Microsoft Excel file for this spreadsheet (.XLS - 24K).
  6. Paste the ranges of Y coordinates back into the Microstran node table.
  7. Exit from Table Input, saving the changes.

1. Create Parallel-Chord Truss

Entering the parameters shown in the dialog box produces the truss shown below:

2. Sort Nodes

In order to have the nodes in each chord listed in a separate range of cells in the spreadsheet, it is necessary for them to be consecutively numbered. This is easily achieved with the Renumber command, using the default sort settings in the dialog box below.

3. Copy Range of X Coordinates to Clipboard

The screen shot below shows the node table in Microstran's Table Input with the range of X coordinates selected, ready for copying. To copy this range to the "clipboard" press Ctrl+C .

4. Paste Range of X Coordinates into Spreadsheet

In the spreadsheet program, select the X coordinates column and click on the  button (or press Ctrl+V) to "paste" the range of X coordinates from the clipboard to the spreadsheet.

5. Input Parameters in Spreadsheet

In the spreadsheet, the span is automatically calculated as the maximum X value. Enter the truss depth at the supports and at the center, and the rise in the top chord. The spreadsheet will then calculate the corresponding Y coordinates for the top and bottom chords. The graph embedded in the spreadsheet provides a check on the calculated geometry. Note the formula for cell C27 displayed at the top of the spreadsheet. This formula, in each of the top chord cells, creates a parabola for laying out the top chord nodes but any other suitable formula may be used if required. A similar formula is used for the bottom chord Y coordinate cells. See above if you want to download the Microsoft Excel file for this spreadsheet.

6. Paste Ranges of Y Coordinates Back to Microstran

The screen shot above shows the range of Y coordinates for the top chord selected in the spreadsheet, ready for copying. To copy this range to the clipboard, click on the  
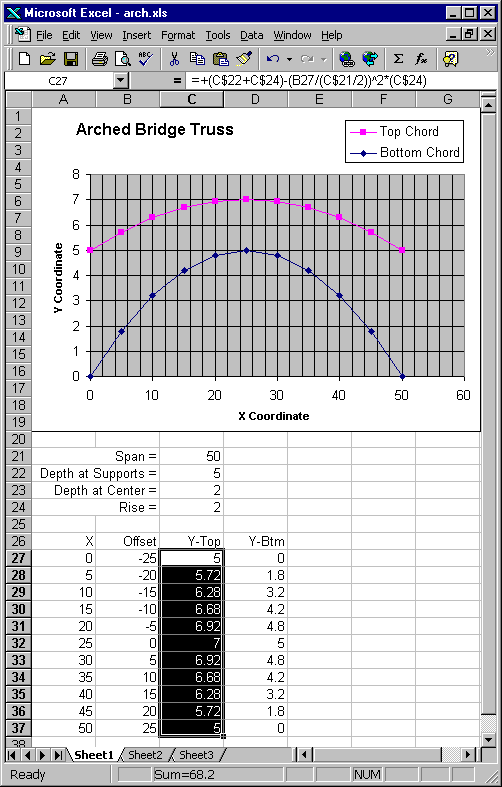
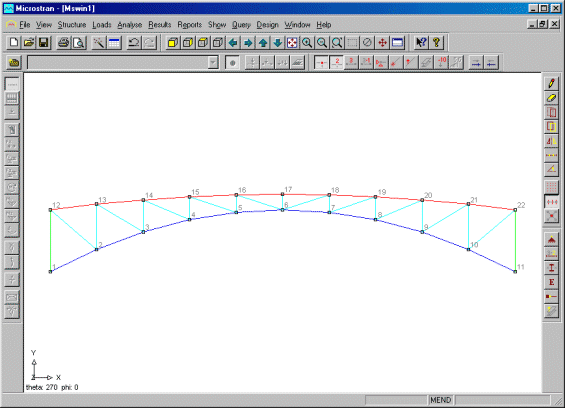
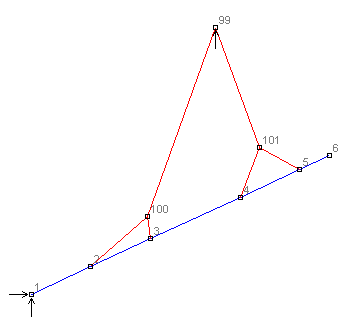
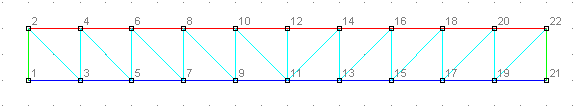
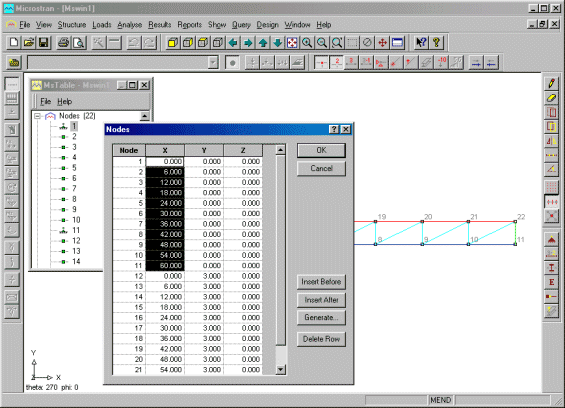
button (or press Ctrl+C). Select the corresponding range of Y coordinates in the Microstran node table and press Ctrl+V to paste the new coordinates back into the structure. The view of the structure changes to show the new coordinates when you exit from Table Input, saving the changes. Below is a screen shot showing the finished structure.

FAQs: Microstran at Bentley

$
0
0


In November of 2013, the exciting news that the business of Engineering Systems, and the Microstran software product line, are now part of Bentley Systems was announced. The popular software products Microstran, Limcon, and MStower are now part of Bentley’s structural analysis and design portfolio alongside RAM and STAAD. Further, the Engineering Systems staff has joined our Bentley offices in Australia, bringing with them over 25 years of experience in developing and supporting a market leading software solution for structural engineers and designers. The details of the acquisition can be found at: http://www.bentley.com/en-AU/Corporate/News/Quarter+4/engineering+systems.htm. This article addresses some commonly asked questions concerning the acquisition.


How does the acquisition affect the Microstran product line?

Microstran is now being packaged and licenced a little differently than it has been in the past. Specifically, Microstran is now offered in three tiers:

  • Microstran
  • Microstran.Pro
  • Microstran.Advanced

Each of these tiers contains an increasing number of features that in the past were sold as separate add-ons by Engineering Systems. Microstran contains elastic critical load analysis and master-slave constraints. Microstran.Pro contains the prior two add-ons, plus dynamic analysis (eigenvalues), cable elements, reinforced concrete design, and steel detailing neutral format. Microstran.Advanced contains all previously mentioned add-ons plus moving loads, gap and fuse elements, and response spectrum analysis.

The design code standards are still offered as individual add-ons that can be applied to any of the three tiers. This is also true of the integrated steel connection design feature within Microstran.

How does the acquisition affect maintenance and support?

Engineering Systems customers will be contacted just prior to the expiration of their existing maintenance plan with Engineering Systems. At this time you will be presented options for moving onto a Bentley SELECT maintenance plan, which will give you access to a wealth of new benefits in support of your Microstran products. A Bentley SELECT plan includes:

  • Annual software upgrades and incremental updates – accessible any time
  • Unlimited technical support - 24 hours/day, 365 days/year
  • Software licencing over the internet (no more dongles)
  • Floating network licencing
  • Online training resources
  • Access to technology previews and early adopter programs
  • Free iPad and desktop utility applications
  • Ability to review and manage your software usage

See the following link for more information on Bentley SELECT:

http://www.bentley.com/en-US/Subscriptions/Bentley+SELECT/


What does the future hold for the Microstran product line?

Engineering Systems technology is an important part of our initiatives to better serve Australia, New Zealand, and greater SEAPAC. In the coming months, you can expect the following enhancements:

  • Access to your products without the need of a hardware dongle.
  • Export capabilities that will allow reuse of Microstran models in other Bentley design, detailing, collaboration, and mobile products.
  • These benefits will be available only to Bentley SELECT subscribers.

Further, later in 2014 we will be releasing a state of the art tower analysis and design product that is the best of Bentley and Engineering Systems combined technology. Customers whose MStower product is covered under Bentley SELECT will not be required to pay an upgrade fee for this product.

Who do I contact for more information?

To ask a technical question, please visit our structural user forum. If you require hands on technical support, please visit our solution support center.

Alternatively, if you are new to the Microstran product line and would like more information, please contact:

Existing Bentley customers may also contact their current sales representative.

Where can I find the legacy Microstran FAQ?

 Those topics are now all included in the Structural Analysis and Design Support Solutions.


Custom Activation Groups

$
0
0

  
 Applies To 
  
 Product(s):ALL
 Version(s):XM and higher
 Environment: N/A
 Area: N/A
 Subarea: N/A
 Original Author:Bentley Technical Support Group
  

What are Custom Activation Groups?

Custom Activation Groups are site activation keys that allow your organization to provide users with valid licensing information without releasing your organization’s primary site activation key. Custom Activation Groups can be created for specific products with specific expiration dates within the product and date constraints of your license pool and SELECT agreement.

Utilizing a Custom Activation Group allows for the sub-division of your site’s license pool for distribution to various designated groups while also allowing for usage tracking. Application usage for Custom Activation Groups is recorded against the main site to which the key is created, and there are multiple reports available in the SELECTserver interface which can be used to view the usage data.

Who Can Use a Custom Activation Group?

Typically, Custom Activation Groups are utilized by organizations that have internal departments sharing a license pool but want to limit the applications available to each group. However, Custom Activation Groups can be utilized in many other scenarios where your organization collaborates with others (such as contractors or project participants).

Since a Custom Activation Group is just a type of sub-division of your organization’s license pool, the activation information can be used anywhere your primary site activation key can be used. Client machines will connect to your organization’s SELECTserver in order to activate.

  • If your organization utilizes SELECTserver OnLine (Bentley Hosted server), then users will only need access to the internet.
  • If your organization does not utilize SELECTserver Online, and maintains SELECTserver locally, your Site Administrator will be responsible for interfacing with your organization’s IT Support in order to grant users access to your SELECTserver.

How do I Create a Custom Activation Group?

Access to your organization’s SELECTserver Administration Page is required to create a Custom Activation Group. (For organizations utilizing SELECTserver OnLine, a Bentley Login and Password is required with the appropriate permissions.)

1. Navigate to your SELECTserver Administration Page. From the Navigation Bar, go to Site Configuration, then, Custom Activation Groups.

      • If your SELECTserver manages multiple sites, choose the desired site from the “Select a site to configure” dropdown.

2. Click the New Group button.


3. A pop up box requesting the following information will appear.


      • The Group ID will auto fill based on your site ID as well as the number of Custom Activation Groups you have already created, i.e. “Your Site ID-01,” “Your Site ID-02,” etc.
      • The Activation Key will also auto populate with a unique sub-key that begins with the letters VS.

4. Enter a Group Name. (A Group Description is optional.)

5. Click the Check Box to select the applications available via the Custom Activation Group.

      • If restrictions are not configured, then all of the site’s applications will be available for use.

      • The products listed in the Application list will display based on the products available in your License Pool.
      • It is not possible to restrict the quantity of licenses. The quantity of licenses available for each product will be the quantity available on the main site activation key.

How Do I activate with a Custom Activation Group?

Click here for detailed information on activating an application based on your organization’s SELECTserver configuration.

Major Error in RAM Connection 9.1

$
0
0

While I appreciate the effort to allow an ACI Appendix D override in RAM Connection 9.1, it should either perform a complete calculation, or simply turn off the check altogether.  When the option to provide primary shear reinforcing is selected, no option is given to select a number of ties, only a rebar size (i.e. #4 bar, grade 60).  This leads to implausable results that are worse than ignoring the reinforcing.  Please issue a patch either turning the check off when reinforcing is selected, or giving the user the option to choose a specific number of bars.

The only work around I can think of would be to put in a bar grade that is a multiple of the number of bars provided. If you have 12 ties w/ 2 legs each, the grade would be 12*2*60ksi=1440ksi

Viewing all 1421 articles
Browse latest View live


<script src="https://jsc.adskeeper.com/r/s/rssing.com.1596347.js" async> </script>